Ohio collects a wealth of data on school districts across the state. How that data is used in comparisons and decisions depends on who you ask.
The Talawanda School District spent just shy of $15,000 per student during the 2023-24 school year, a number that Hanover Township resident and retiree Mike Dittman is intimately familiar with.
“I’ve been going to board meetings for over 15 years,” Dittman said. “... My motivation is, how can we get a good education without all these extra frills and wasting a lot of money?”
Over the years, Dittman has honed in on the per-pupil expenditure to compare Talawanda to other districts. He’s spoken about his concerns at numerous Board of Education meetings over the years and under different boards, including at the last three meetings.
The per-pupil spending metric is just one number among many. The Ohio Department of Education and Workforce uses dozens of datapoints to evaluate school district demographics and performance, from the annual finance-heavy Cupp Reports to the more qualitative district report cards.
This story is the second in a series on school finances and the Talawanda School District. The next installment will focus on state funding for public education.
A wealth of information
Looking to compare the rates of economically disadvantaged students per district from 2005 onward? There’s a dataset for that. More interested in the number of students per square mile in a given district? You can find those numbers, too. With the sheer volume of numbers at the districts’ and state’s disposal, it may not be clear how the available data guides decisionmaking.
For Talawanda treasurer Shaunna Tafelski, honing in on specific metrics may actually obscure the differences between districts that can factor into the cost of educating kids. While cost of education per pupil is an easy to understand number, for example, it doesn’t account for differences in curriculum, how geography may impact transportation, a district’s unique special education needs and other differences, Tafelski said.
“You really have to look at each and every component for each school district, and people don’t do that,” Tafelski said.
Comparisons also depend on the source of data. If you read the most recent Cupp Report, you’ll find that Talawanda spends nearly $15,000 per student. Take a look at the financial data within the district report card, and that number drops to $12,200, even though both reports are generated by the Ohio Department of Education and Workforce.
If your only goal is to compare Talawanda to Ross School District, you could come away thinking that Talawanda spends either $560 or $971 more per student, depending on the source you use. (The Oxford Free Press has used Cupp Report data for financial information in this story due to additional data not available in district report cards).
Despite that, Dittman says the per-pupil measure is an easy-to-understand and easy-to-compare metric. When you compare Talawanda to the three similarly sized districts in Butler County — Edgewood, Ross and Monroe — the district easily outspends them on a per-pupil basis.
“When you look at some of the other measures, they always come up with, ‘Well, other schools report things differently,’” Dittman said. “Well, this is a state report, and we have to assume the state is doing it accurately. When it comes to cost per pupil, it's a good evaluation to compare. I don’t know what else would be a better one.”
The data tells a more complicated story when you drill into it. More of Talawanda’s budget per pupil goes to instructional costs than any of the three local comparison districts, and less of Talawanda’s budget goes toward administration. Edgewood and Monroe both put more money toward pupil support than Talawanda, though, while building operations made up a more significant portion of Ross’ budget.
Less local comparisons
But there is another set of similar schools to compare Talawanda to: districts in small college towns with D1 public universities.
Among that group, which includes the Kent, Athens and Bowling Green city school districts, Talawanda’s per-pupil spending drops to the bottom. Other metrics could paint a different picture. Talawanda has some of the highest average administrator salaries but the least administrators per pupil regardless of which set you compare it to. The district also has fewer students with disabilities than other college town districts and lower teacher salaries than Athens and Kent.
All of those datapoints and more factor into Ohio’s own complex formula to provide state funding to local districts. Talawanda uses a higher income tax but lower property taxes than other college town districts, for example. The state provides just 23% of Talawanda’s revenue per pupil, the least of similar college town districts and local districts alike. Across Ohio, local and state funding for districts typically run almost even.
For board member Pat Meade, who recently advocated for increased investment in educational efforts across the district, the college towns provide a more apt comparison for Talawanda. Each district relies on property taxes but has a major landowner exempt from paying them, and the districts include both small urban centers and rural outer areas.
“I think we can look at both,” Meade said. “I have no problem with looking [at local districts], but I don’t think that should be the end of our conversation about whether we’re really spending more than we need to spend.”
Spending metrics also don’t take achievement into account. On its most recent state report card, Talawanda earned 4.5 stars, earning 22 out of 25 marks across the five major categories measured. The district outperformed all of the similar college town schools, particularly in graduation and early literacy, despite spending less than any of them per pupil. Locally, only Ross earned higher marks than Talawanda among similar sized districts.
Cutting costs or raising investments
Regardless of the metrics used, Dittman said his goal for the district as a taxpayer has always been fiscal conservatism.
During the property tax increases of 2023, during which property owners across Butler County saw an average increase of 37% in their property taxes. Dittman said his own property taxes went up by roughly 50%, and he’d like to see more state funding directed toward schools to give some local relief. Beyond property taxes, though, some of Dittman’s income from his pension goes toward Talawanda each year thanks to the passage of a 2004 income tax to support the district.
Dittman says his point isn’t that he’s anti-education. “That’s the farthest from the truth,” he says, and he and his wife sponsor a scholarship for students in Talawanda, Ross and Edgewood. “Education is the key to everybody’s ability to get ahead in life … but there is an expectation that our taxpayer funds are used efficiently. I don’t think we do as good a job as we should.”
For some in the district, though, including Meade, Talawanda’s current financial situation calls for increased spending, not cuts.
Every six months, Tafelski presents a five-year forecast on the district’s finances. Last November, her projection that the district could have more than 250 days’ worth of cash on hand — $33 million — by the end of fiscal year 2029 led Meade to ask for ways to spend that money. Board policy requires that the district keep at least 90 days’ of cash on hand.
“The taxpayers give us money to provide an education for the students. We should spend that money,” Meade said. “We should spend the money carefully, with prudence, for the students … We’re given this money to invest in the kids, not put in the bank.”
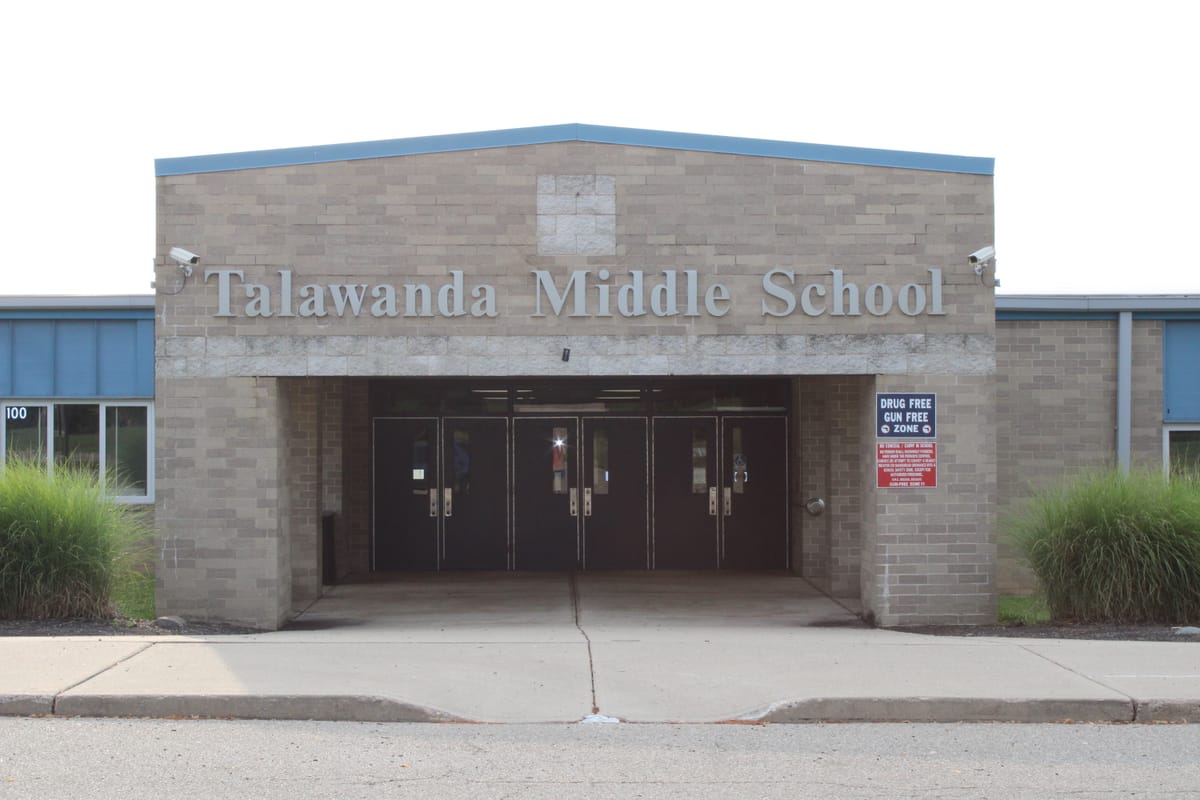
Theroux presented potential items to invest in at the board’s December meeting. His items, identified through conversations with school leadership, included a new Elementary Title 1 teacher for fourth and fifth grade, a school psychologist for Talawanda Middle School, a half-time high school counselor, an instructional coach and two elementary teachers to reduce classroom size.
Like many district-level choices, the specific roles tie back to state policy and data. Elementary class sizes at Bogan and Marshall in particular are increasing, so new teachers would help meet that demand. Districts must meet new standards for student reading requirements in fourth and fifth grade which will in turn require the “high dosage” tutoring a Title 1 teacher would provide, Theroux said. The middle school psychologist, meanwhile, would bring back a role that was cut after a property tax levy failed in 2022.
If new staff positions are created, Theroux said at the meeting that it would need to be done by March to allow for accurate budgeting and hiring.
At that meeting, Tafelski emphasized the need for caution, particularly as hiring additional staff members lead to increased costs down the line. For Meade, though, those costs are worth it.
“That’s $2 million a year over the next five years,” Meade said. “We’ll have $31 million in the bank instead of $33 million. Ouch. I’m sorry, if we need things for students, then that’s what that money’s for.”
Meade’s calls for increased spending come at a time when state lawmakers including Republican House Speaker Matt Huffman are calling to cut state funding for public schools. Even if Talawanda parents and leadership want to spend more on hiring staff or other initiatives, a loss in state funding could make that significantly more difficult.
The next installment in the Oxford Free Press’ series exploring education funding will focus on how state funds get to local schools, and whether that funding source is on the line.